Raleigh’s Three-Homer Game an Exception in a Dumper of a Season
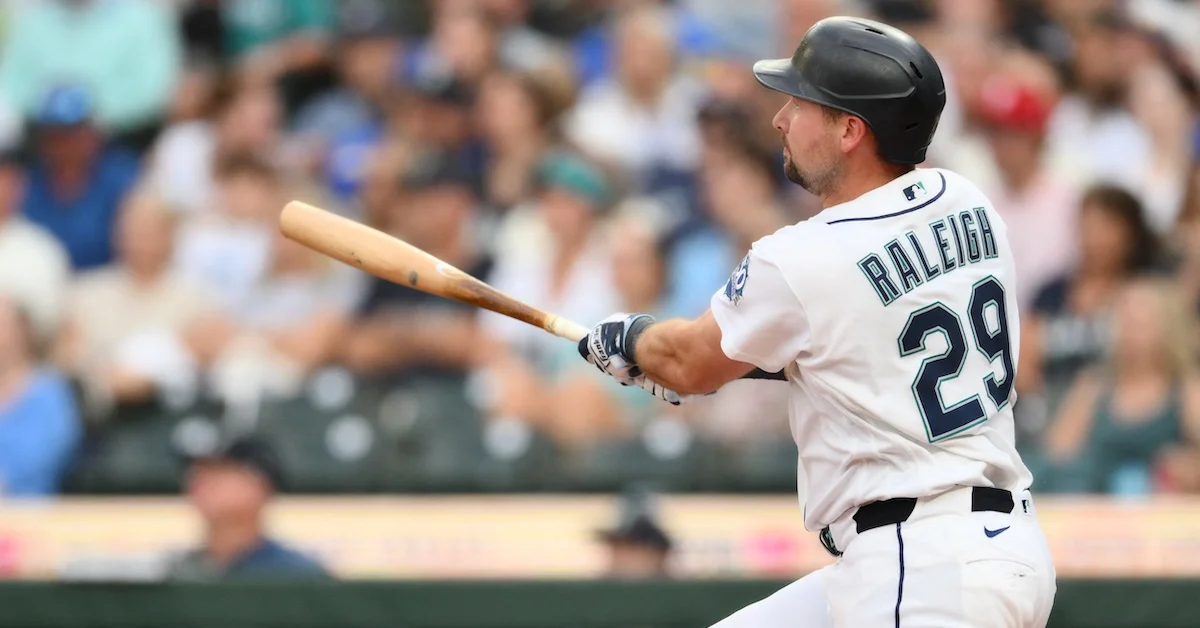
If you’ve been watching the Mariners the last couple of nights, you might feel like you’re back in the halcyon days of 2025. Seattle took the first two games of its series against one of baseball’s best teams, the Phillies, and Cal Raleigh launched four home runs over two nights, including a three-dinger outburst on Monday. Unfortunately, that feeling has been fleeting in 2026, as the Mariners are comfortably below .500 and have only remained in the divisional and Wild Card races because their competition has been exuberantly mediocre. As for Raleigh, after hitting 60 home runs and just missing out on the American League MVP award to Aaron Judge, he’s suffered through easily the worst season of his professional career. Raleigh’s collapse this year has been historic in its magnitude, yet both he and the M’s could still come out of this playing October baseball.
When you see a season like Raleigh’s 2025, it’s natural to expect some kind of regression toward the mean. Indeed, it’s so expected a phenomenon that a whole panoply of curses have been coined to explain it without having to get all mathy about it. Did you just have a horrible season after a great one? Well, you may have been cursed by the Sports Illustrated cover, the Madden NFL cover, a Wheaties box, a Heisman award, a sophomore slump, or an MLB the Show cover. Or maybe you just drank Jobu’s rum. Whatever you call it, Raleigh’s 2026 is well past regression to the mean and more like regression to the really frigging mean. I swear, that’s a technical term.
So just how bad a season has Raleigh had compared to expectations? You could probably just say “Austin Hedges has a wRC+ more than 20 points higher than Raleigh.” Or maybe graph Raleigh’s year-to-year home run totals, with the chart properly labeled so that people don’t think they’re viewing a win expectancy graph from a game where late-period Craig Kimbrel was the closer. But since we have a projection system handy, we can do better than that.
After a 161 wRC+ last season, ZiPS projected a 30-point drop for the Big Dumper back in March. Thirty points is a pretty big drop-off, but a 131 wRC+ would rank third in baseball among catchers with 200 plate appearances this year, behind only Ryan Jeffers and Gabriel Moreno. Instead, Raleigh has missed his projection by 44 points of wRC+, and that’s after clawing back a shocking 14 points in just two games. A 74-point season-to-season drop-off is quite the cliff. In fact, if we look at two-year runs of 400 or more plate appearances for every AL/NL hitter since 1901, Raleigh’s decline is way up there:
| Player | Season | wRC+ | Season | wRC+ | Difference |
|---|---|---|---|---|---|
| Victor Martinez | 2014 | 167.6 | 2015 | 76.7 | -90.9 |
| Cal Raleigh Through Sunday | 2025 | 161.2 | 2026 | 73.0 | -88.2 |
| Bryce Harper | 2015 | 197.2 | 2016 | 110.8 | -86.4 |
| Mike Epstein | 1972 | 163.9 | 1973 | 81.9 | -82.0 |
| Scott Brosius | 1996 | 130.9 | 1997 | 49.8 | -81.2 |
| Roy Campanella | 1953 | 153.7 | 1954 | 75.2 | -78.5 |
| Dick Green | 1969 | 121.3 | 1970 | 44.6 | -76.7 |
| Adam Dunn | 2010 | 135.9 | 2011 | 60.4 | -75.5 |
| Rogers Hornsby | 1925 | 202.0 | 1926 | 126.6 | -75.4 |
| Sandy Alomar Jr. | 1997 | 131.0 | 1998 | 56.3 | -74.6 |
| Cal Raleigh | 2025 | 161.2 | 2026 | 86.9 | -74.3 |
| Chris Davis | 2013 | 167.5 | 2014 | 94.2 | -73.3 |
| Jeff Burroughs | 1978 | 159.6 | 1979 | 87.0 | -72.6 |
| Max Carey | 1925 | 130.0 | 1926 | 57.8 | -72.2 |
| John Mayberry Sr. | 1975 | 166.4 | 1976 | 94.2 | -72.1 |
| Babe Ruth | 1924 | 203.4 | 1925 | 131.6 | -71.8 |
| Adrian Beltré | 2004 | 161.0 | 2005 | 89.7 | -71.4 |
| Reggie Jackson | 1982 | 145.0 | 1983 | 73.6 | -71.3 |
| Don Buford | 1971 | 151.3 | 1972 | 82.2 | -69.1 |
| Sixto Lezcano | 1979 | 164.7 | 1980 | 96.7 | -68.0 |
| Juan Gonzalez | 1993 | 164.1 | 1994 | 96.2 | -67.9 |
| Ken Singleton | 1983 | 128.8 | 1984 | 61.1 | -67.7 |
| Mark Teixeira | 2015 | 143.2 | 2016 | 75.6 | -67.6 |
| Dick Allen | 1974 | 163.4 | 1975 | 96.0 | -67.5 |
| Ross Youngs | 1924 | 159.3 | 1925 | 91.9 | -67.4 |
Before Monday’s games, Raleigh’s drop-off was the second-largest, behind only 2014-2015 Victor Martinez. His outburst Monday and Tuesday was enough to drop him down to 10th, but that’s still uncomfortably high in a table that has 12,720 rows.
Raleigh is also one of the biggest projection misses in ZiPS’ history. I’m using OPS+ this time since I don’t have projected wRC+ going back to 2004, but it wouldn’t change the tables meaningfully:
| Player | Year | Projected OPS+ | Next Year OPS+ | Difference |
|---|---|---|---|---|
| Adam Dunn | 2011 | 139 | 54 | -85 |
| Cal Raleigh Through Sunday | 2026 | 135 | 67 | -68 |
| Bryce Harper | 2016 | 176 | 114 | -62 |
| Chipper Jones | 2009 | 176 | 117 | -59 |
| Chris Davis | 2018 | 107 | 49 | -58 |
| Jackie Bradley Jr. | 2021 | 91 | 35 | -56 |
| José Bautista | 2017 | 134 | 79 | -55 |
| B.J. Upton | 2013 | 109 | 55 | -54 |
| Barry Bonds | 2006 | 210 | 156 | -54 |
| Cal Raleigh | 2026 | 135 | 82 | -53 |
| Vladimir Guerrero Jr. | 2026 | 143 | 90 | -53 |
| Joey Gallo | 2022 | 131 | 79 | -52 |
| Miguel Cabrera | 2017 | 145 | 93 | -52 |
| Allen Craig | 2014 | 118 | 67 | -51 |
| Sammy Sosa | 2005 | 128 | 78 | -50 |
| Brian McCann | 2007 | 149 | 99 | -50 |
| Rougned Odor | 2017 | 112 | 63 | -49 |
| Andruw Jones | 2007 | 136 | 87 | -49 |
| Jim Edmonds | 2007 | 137 | 88 | -49 |
| Carlos Correa | 2018 | 147 | 99 | -48 |
| Marcus Giles | 2007 | 117 | 69 | -48 |
| Spencer Torkelson | 2022 | 122 | 74 | -48 |
| Kyle Tucker | 2026 | 140 | 93 | -47 |
| Jason Heyward | 2016 | 115 | 68 | -47 |
| Domonic Brown | 2014 | 124 | 77 | -47 |
History shows us that hope still remains for Raleigh, and that a large percentage of the players on these two lists had better seasons ahead of them, at least when they returned to get 400 plate appearances the following year:
| Player | Season | wRC+ | Season-to-Season wRC+ Dropoff | Next Year wRC+ | Bounceback |
|---|---|---|---|---|---|
| Victor Martinez | 2015 | 76.7 | -90.9 | 120 | 43.5 |
| Bryce Harper | 2016 | 110.8 | -86.4 | 155 | 44.3 |
| Scott Brosius | 1997 | 49.8 | -81.2 | 123 | 73.0 |
| Roy Campanella | 1954 | 75.2 | -78.5 | 150 | 74.5 |
| Adam Dunn | 2011 | 60.4 | -75.5 | 115 | 55.1 |
| Rogers Hornsby | 1926 | 126.6 | -75.4 | 174 | 47.3 |
| Chris Davis | 2014 | 94.2 | -73.3 | 149 | 54.6 |
| John Mayberry Sr. | 1976 | 94.2 | -72.1 | 100 | 5.4 |
| Babe Ruth | 1925 | 131.6 | -71.8 | 213 | 81.1 |
| Adrian Beltré | 2005 | 89.7 | -71.4 | 106 | 15.9 |
| Reggie Jackson | 1983 | 73.6 | -71.3 | 95 | 21.2 |
| Willie McGee | 1986 | 84.6 | -66.3 | 94 | 9.4 |
| Brook Jacoby | 1988 | 77.8 | -65.9 | 114 | 36.2 |
| Jeff Bagwell | 1995 | 139.5 | -65.9 | 173 | 33.8 |
| Cal Ripken Jr. | 1992 | 90.0 | -64.5 | 95 | 4.8 |
| Carl Yastrzemski | 1971 | 115.1 | -64.2 | 119 | 4.3 |
| George Foster | 1982 | 88.2 | -64.0 | 95 | 6.5 |
| Jim Gentile | 1962 | 117.2 | -63.1 | 122 | 5.0 |
| Mike Napoli | 2012 | 115.5 | -63.0 | 128 | 12.9 |
| Boog Powell | 1965 | 113.6 | -62.7 | 157 | 43.6 |
| Jimmy Wynn | 1971 | 73.8 | -62.5 | 148 | 74.3 |
| Goose Goslin | 1929 | 111.6 | -60.2 | 137 | 25.1 |
| Howard Johnson | 1990 | 106.3 | -59.9 | 140 | 34.1 |
| Snuffy Stirnweiss | 1946 | 86.4 | -59.9 | 99 | 12.6 |
| Tony Peña Sr. | 1987 | 52.5 | -59.6 | 90 | 37.4 |
| Frank Thomas | 1959 | 67.1 | -59.0 | 81 | 14.0 |
| John Olerud | 1994 | 120.6 | -58.7 | 113 | -7.8 |
| Norm Cash | 1962 | 135.2 | -58.5 | 138 | 2.4 |
| Bill Madlock | 1984 | 70.3 | -58.4 | 112 | 41.7 |
| Dick Stuart | 1962 | 82.2 | -58.3 | 126 | 43.9 |
| Gary Gaetti | 1989 | 86.3 | -57.8 | 74 | -12.0 |
| Cito Gaston | 1971 | 86.7 | -57.7 | 97 | 10.4 |
| Edgardo Alfonzo | 2001 | 92.6 | -57.7 | 129 | 36.5 |
| Aubrey Huff | 2009 | 76.8 | -57.6 | 144 | 67.0 |
| Mickey Vernon | 1947 | 96.6 | -57.5 | 72 | -24.6 |
| Ted Simmons | 1981 | 85.0 | -57.0 | 110 | 24.7 |
| Jeff Burroughs | 1975 | 101.5 | -56.2 | 103 | 1.1 |
| Cy Seymour | 1906 | 118.0 | -56.0 | 129 | 11.4 |
| Joe Torre | 1972 | 117.0 | -55.9 | 117 | 0.3 |
| Felipe Alou | 1969 | 83.1 | -55.6 | 87 | 3.7 |
| Eddie Murray | 1991 | 100.9 | -55.4 | 114 | 13.4 |
| Ralph Garr | 1975 | 85.3 | -55.1 | 105 | 19.5 |
| Aramis Ramirez | 2002 | 70.2 | -54.6 | 101 | 31.1 |
| Don Mattingly | 1990 | 72.3 | -54.4 | 99 | 27.0 |
| Orlando Cepeda | 1968 | 104.9 | -54.4 | 106 | 0.9 |
| Hack Wilson | 1931 | 114.7 | -54.0 | 138 | 23.4 |
| Billy Williams | 1973 | 116.0 | -54.0 | 126 | 10.0 |
| Frank Thomas | 1998 | 125.7 | -53.5 | 126 | 0.1 |
| Paul Goldschmidt | 2023 | 122.1 | -53.3 | 100 | -22.5 |
| Paul Blair | 1968 | 82.1 | -53.2 | 125 | 42.5 |
Now, there’s some selection bias involved here, in that players who didn’t recover from their collapses were more likely to not get 400 plate appearances the following season, but the players who did come back — and I doubt the Mariners would fail to give Raleigh a pretty long runway in 2027 given his history and the fact he’ll only be 30 — usually clawed back about half of their missing wRC+. The top 100 drop-offs averaged 56 points of wRC+ decline, and 91 of those players recouped something the following season, averaging a 26-point wRC+ improvement. Twenty-six points of wRC+ would put Raleigh at a 113 mark, and even though the M’s would prefer to get a full-on 2025 performance, 113 isn’t a bad wRC+ for a competent catcher by any stretch of the imagination.
What’s more, Raleigh has a better bounce-back argument than many of the players on the list. First, a lot of the players with the biggest drop-offs were older than Raleigh is, and at age 30 for the 2027 season, he’s certainly young enough to make good on his wretched 2026. There’s also another mitigating factor in that his worst stretch of the year was in early May, after injuring his right oblique and then attempting to play through it. That 2-for-36 skid ate a nice little chunk of his seasonal numbers, and while he didn’t hit well otherwise (a .667 OPS before the injury, a .691 OPS since returning), that week was enough to carve out 50 points of OPS from his seasonal line. He’s also been a bit unfortunate in terms of BABIP. While he’s typically a low-BABIP hitter and likely will remain so, .197 is inconceivably low as a sustainable level. After all, during the Statcast era, pitchers combined for a .232 BABIP when not attempting to bunt, meaning that’s the practical floor for a major league hitter with all of his limbs intact.
The ZiPS projection for Raleigh for 2027 still indicates a very solid player, though not a preseason AL MVP favorite:
| Year | BA | OBP | SLG | AB | R | H | 2B | 3B | HR | RBI | BB | SO | SB | OPS+ | WAR |
|---|---|---|---|---|---|---|---|---|---|---|---|---|---|---|---|
| 2027 | .216 | .318 | .445 | 510 | 69 | 110 | 18 | 0 | 33 | 91 | 73 | 172 | 4 | 119 | 4.2 |
| 2028 | .211 | .315 | .423 | 503 | 65 | 106 | 17 | 0 | 30 | 85 | 73 | 171 | 4 | 112 | 3.7 |
| 2029 | .210 | .313 | .415 | 491 | 62 | 103 | 17 | 0 | 28 | 79 | 71 | 169 | 3 | 110 | 3.4 |
| 2030 | .203 | .307 | .388 | 474 | 57 | 96 | 16 | 0 | 24 | 71 | 68 | 167 | 3 | 101 | 2.7 |
| 2031 | .198 | .303 | .371 | 450 | 51 | 89 | 15 | 0 | 21 | 63 | 64 | 163 | 3 | 95 | 2.3 |
| Percentile | 2B | HR | BA | OBP | SLG | OPS+ | WAR |
|---|---|---|---|---|---|---|---|
| 95% | 28 | 46 | .265 | .367 | .554 | 162 | 7.2 |
| 90% | 25 | 44 | .252 | .356 | .533 | 151 | 6.4 |
| 80% | 22 | 40 | .238 | .344 | .505 | 140 | 5.7 |
| 70% | 20 | 37 | .230 | .333 | .484 | 131 | 5.1 |
| 60% | 19 | 35 | .223 | .325 | .469 | 126 | 4.6 |
| 50% | 18 | 33 | .216 | .318 | .445 | 119 | 4.2 |
| 40% | 17 | 31 | .208 | .311 | .429 | 112 | 3.7 |
| 30% | 16 | 29 | .202 | .303 | .411 | 106 | 3.4 |
| 20% | 15 | 26 | .192 | .296 | .390 | 99 | 2.9 |
| 10% | 12 | 23 | .178 | .283 | .361 | 89 | 2.2 |
| 5% | 11 | 21 | .170 | .268 | .344 | 79 | 1.4 |
Yes, you’d rather see Raleigh hit in the .240s than the .210s, but I doubt the Mariners would turn down that seasonal line. By the percentiles, there’s a 93% chance of him having a better OPS+ than this year’s 82.
The big question might be when the Mariners get that bounce back. Given the precarious state of the pennant race, which version of Cal Raleigh they get the rest of the season is going to have a significant effect on their playoff hopes. As unimpressive as the M’s have been in 2026, they aren’t that far back in either the division or Wild Card race, and ZiPS agrees with our playoff odds that they have easily the weakest schedule remaining of any team in baseball. The projected rest-of-season version of Raleigh gives the Mariners a 31% chance of making the playoffs. If he plays like he has so far in 2026, that probability drops to 23%. But if he channels 2025 and returns to that form, the projected probability zooms up to 49%, almost a coin flip. That’s a massive swing in the playoff odds from a single player, so you could say the M’s season largely rests on Raleigh’s… shoulders.
Raleigh has had an awful year, but the future isn’t written in permanent ink. If the Big Dumper rakes down the stretch and the Mariners play October baseball instead of October golf, the whole season up to this point will be forgiven and forgotten. Regression away from the really frigging mean could be just enough to salvage Seattle’s season.