FanGraphs Weekly Mailbag: July 4, 2026
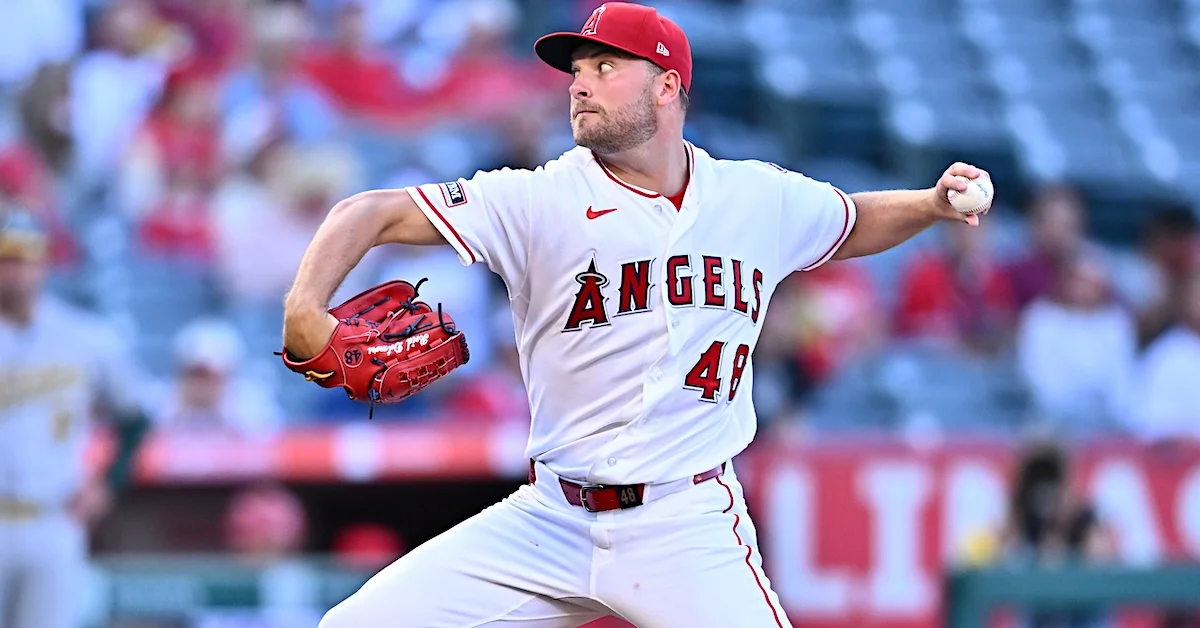
Happy Fourth of July! To commemorate the United States’ Semiquincentennial, I’m going to run through some fun baseball stats that feature the number 250, and also ask a few trivia questions, which you can answer in the comments. As of Thursday morning, there is one player in MLB history with exactly 250 career home runs. He’s an active player for an NL West team. Can you name him? Seven players have recorded exactly 250 doubles in their career; only one of them is in the Hall of Fame. The six non-Hall of Famers are Ozzie Albies, Travis Hafner, Deivi Cruz, Bruce Bochte, Irish Meusel, and Jake Daubert. The Hall of Famer is a 19th century catcher. Who is it?
There are 25 members of the 250 Home Run/250 Stolen Base Club, nine of whom are Hall of Famers. Sorted by home runs, those nine are Willie Mays (660 HR, 339 SB), Andre Dawson (438, 314), Carlos Beltrán (435, 312), Rickey Henderson (297, 1,406), Craig Biggio (291, 414), Ryne Sandberg (282, 344), Joe Morgan (268, 689), Derek Jeter (260, 358), and Robin Yount (251, 271). Two others are active: José Ramírez (295, 311) and Jose Altuve (263, 326). Can you name the other 14 members of the 250/250 Club? Lastly, seven players have tallied at least 250 hits in a season. Six of them — Ichiro Suzuki (262 in 2004), George Sisler (257 in 1920), Bill Terry (254 in 1930), Al Simmons (253 in 1925), Chuck Klein (250 in 1930), and Rogers Hornsby (250 in 1922) — are Hall of Famers. Can you name the one non-Hall of Famer?
I’ll reveal the answers in next week’s mailbag. In this week’s edition, we’ll answer your questions on challenging the first pitch of a game, sustained runs of low playoff odds, a team of Frank Thomases and Luis Aparicios, and more. But first, I’d like to remind you that this mailbag is exclusive to FanGraphs Members. If you aren’t yet a Member and would like to keep reading, you can sign up for a Membership here. It’s the best way to both experience the site and support our staff, and it comes with a bunch of other great benefits. Also, if you’d like to ask a question for an upcoming mailbag, send me an email at mailbag@fangraphs.com.
__
The Marlins challenged the first pitch of the game on Saturday, June 20, against the Giants. How many other times has that happened this year, if at all? — Connor
As I reported two weeks ago, ABS strategy varies from player to player and team to team, but generally, players are more likely to challenge ball-strike calls later in games and in higher-leverage situations. Still, there are times when players decide to challenge pitches early in games, such as the one Connor mentioned in his question.
On June 20, Luis Arraez was leading off for the Giants against Marlins right-hander Max Meyer, who started the game with a 94.6-mph four-seamer up and away. The pitch was called a ball. Catcher Joe Mack challenged it, and ABS revealed that the pitch just barely clipped the corner. It probably wasn’t the best strategic use of a challenge, because it was the first pitch of the game and not an egregious ball call, but it worked out for Mack and the Marlins. Arraez fouled off three two-strike pitches before grounding out on the seventh pitch of the at-bat, and then, after a one-out walk, Meyer struck out the next two batters to get out of the inning. He went five innings, allowed seven hits, two runs, and two walks, and struck out seven. The Marlins won, 6-3, and Meyer improved to 8-0 on the season.
I asked Jon Becker to pull first-pitch challenge data. We defined “first pitch” as non-swings on the first pitch of the top of the first and the bottom of the first, meaning the first pitch each team could challenge while batting and pitching. We thought the difference between the two situations was marginal, and that it would give us a bit larger of a sample. As of Thursday morning, when I’m writing this response, there have been 25 challenges on the first pitch of the first inning, out of 1,876 pitches taken, for a challenge rate of 1.3%. The success rate on first-pitch challenges, as expected, is higher than the overall rate; 17 of the 25 challenged first-pitch calls have been overturned (68%), compared to the overall overturn rate of 53%.
Catchers are the ones doing the bulk of the challenging on the first pitches they receive in a game. They accounted for 17 of the 25 challenges, leading to 13 of the overturned calls. That success rate of 76% is well above the overall success rate for defenses (58%), though that figure includes pitcher challenges, who are less successful than catchers. For their part, batters have overturned four of the eight first pitches they’ve challenged; that 50% rate is also higher than their overall success rate of 48%.
What can we learn from this? Not a whole lot. Still, I found it interesting.
__
Greetings —
I saw the Nationals’ Playoff Odds recently crept up around 6%, although they slunk down below 4% before I got a chance to send this email. The 6% felt like a high-water mark since the Nats started their current awful run in 2021. Am I right about that?
This got me thinking that sustaining Playoff Odds this low requires both low expectations to start the season and poor in-season results, including no hot starts allowed. Is the Nats’ recent run historically significant at all within the Wild Card era, in terms of Playoff Odds never approaching 10% at any point during a five-year (or longer) run?
Thanks!
Ryan in Maryland
Davy Andrews: Hi Ryan in Maryland,
This is Davy from Virginia (but in New York). Before I dig into the numbers, I need to thank Jon Becker in Illinois, who did the work of digging up the daily Playoff Odds data going all the way back to 2014. He’s the real hero here. As such, I’m two years shy of being able to talk about the entirety of the Wild Card era, but it should be sufficient for our needs.
As to your first question, you’re right, but you started one year too early. The Nationals’ Playoff Odds got as high as 24% during the beginning of the 2021 season, but they fell below 10% on July 2 (happy birthday to my nephew!) and they have yet to make it back to that threshold. In fact, from 2022 to 2025, they never even made it above 3.5%. It’s brutal stuff. I’m writing this on Tuesday, and unless they rip off a very impressive winning streak, by the time you read this on Saturday, they will have made it to five calendar years under 10%. If they don’t make it back up to 10% this year, then they’ll be at five full seasons.
Now, the Nationals are only a couple of games out of the last Wild Card spot right now, so they’ve got a genuine chance to make it up to 10%. However, that might be a tall order. It will probably require them to be in the hunt right at the very end of the season, because, as I wrote earlier this week, our projections (and therefore our Playoff Odds) do not believe in this team. They’ll have to get awfully close before the Playoff Odds will give them a chance.
A bunch of teams have had three-year streaks below 10%. Here’s the list: The Braves and Phillies starting in 2015, the Padres in 2016, the White Sox in 2017, the Pirates in 2020, and the A’s in 2022. The Reds had a four-season streak from 2015 to 2018.
The Nationals don’t have the longest streak in our database. That honor belongs to the Rockies, who last boasted Playoff Odds of 10% or better on September 16, 2020. That’s five full seasons and counting. This may sound hard to believe, but the last time the Rockies had Playoff Odds as high as 1% – ONE PERCENT! – was May 9, 2022. That’s four years, one month, and 25 days ago. Worry not, Ryan in Maryland. Things could always be worse, because you could always be Ryan in Colorado.
__
Hi Mailbag Gang,
Recently, I was watching Reid Detmers, everyone’s favorite most frustrating pitcher, and noticed that he started falling apart because his location was off by only an inch or two. When Reid is on the right side of the shadow zone, he’s an ace-level talent, but when he starts missing ever so slightly, he looks like a bust. It’s remarkable how his success rides on such a thin edge. So my question is: What pitcher is the most reliant on nailing the shadow zone? I would have thought pitchers who lived in the shadow zone were relatively successful, but is that true? Do all shadow-zone pitchers have a Jekyll-and-Hyde type of breakout depending on their locating ability that day?
Cheers,
Dr. Plantwrench
Ben Clemens: The shadow zone (the edges of the plate and the area just off of it) is both incredibly named and incredibly difficult to analyze. It’s the part of the plate where, like you said, small differences in location matter most. But that’s actually a little bit of a trick. Sure, it’s better to just nick the corner than to miss it by a fraction of an inch, but missing it by a fraction of an inch is still pretty darn good. Hitters don’t have the kind of ability to distinguish between pitches — they swing at the ones that are just off the plate plenty.
Still, you’re right that the pitchers who rely on command are generally most reliant on just nibbling the corners. Sean Newcomb has the largest gap between just-in and just-out run value, and he’s not exactly the guy I’d think of for this, but the top of the list is dotted with guys like George Kirby, Aaron Nola, Brent Suter, Erick Fedde, and yes, Reid Detmers. But here’s a complicating factor: The guys on the other side of the list seem kind of similar to me. Chris Paddack is actually worse when he hits the edge, which is bizarre. Michael Soroka, Janson Junk, Chad Patrick, Miles Mikolas, Parker Messick; they’re all toward the bottom of the list of pitchers who most need to hit the corner to succeed. That sounds pretty similar to the other side of the list, so much so that I’m not quite sure how to think about this.
I tried looking at something else: The pitchers who do the worst when they leave the ball over the heart of the plate instead of hitting a corner. This is the same kind of pinpoint command in reverse, essentially; if you try to nibble and leave the ball right down the middle, that’s just as much a miss as if you leave it off the plate. You might imagine that stuff merchants can get away with this, and you’d basically be right: Dylan Cease, Shohei Ohtani, and Roki Sasaki are all among the best in the league at this, and they all perform better on pitches right down the middle than on shadow-zone pitches. That’s because opponents can’t hit the ball even if they swing.
On the other side of the equation, pitchers like Joe Ryan, Connor Prielipp, Eric Lauer, and Sonny Gray all do very poorly over the heart of the plate and very well when they hit the edges. That tracks with what I think about those guys; when they’re giving up meatballs, they’re hittable. Detmers is near, but not at, the top of this list; he’s in the 75th percentile when it comes to how much better he gets when he hits the shadow-in zone instead of the heart.
One final complication, though: This skill doesn’t seem to persist over time. Detmers and Paddack are extreme opposites here, but in their careers, they have nearly the same gap between shadow-in and shadow-out success. So does Ohtani. So does almost everyone, in fact. The bigger gap is between shadow-in and heart. There, however, we’re basically just measuring the guys with good or bad stuff. If you have good stuff, the gap between heart and shadow-in is minor, and in fact, you’d probably prefer to throw a ton of strikes over nibbling. If you have bad stuff, you should avoid the center of the plate.
__
Hello,
The Frank Thomas clone question delighted me, as did the knowledge that at shortstop, Rowdy Tellez would have been the bigger hurt. The awful defensive numbers made me wonder: How would adding some glove-first players affect the record?
So let’s suppose scientists also cloned Luis Aparicio. (Or Maz or someone else you designate, but I feel like Ozzie hit too well for this thought experiment.) I am curious to know what record the all-Aparicio roster would put up, but mostly, I want to know the optimum tradeoff between Big Hurts and big gloves. Shortstop seems obviously worth going glove. But how many more Aparicios do you start among the Thomases, and what would the improved record be?
— Ryan
Dan Szymborski: Ryan,
Knowing that a doughy middle-aged baseball analyst has perfected human cloning, you have not asked me to clone genius scientists or other innovators, but middle infielders. I have to appreciate your prioritizing FanGraphs over the needs of humanity!
As requested, the ZiPS biomedical research lab has been cranking out Luis Aparicios in order to meet the challenge of this moment. Using the same methodology as last week, I have created a full position player array of Luis Aparacio clones. The All Aparacios don’t fare as well as the All Thomases do, and the projected team only goes 80-82. The fundamental problem is that, in addition to first base and DH, there are a few places at which Frank Thomas remains a Hall of Famer (left field, right field, maybe third base if the pitchers don’t murder him), while Aparicio’s skillset is basically maxed out to a good degree as a shortstop.
There’s a kind of diminishing returns on defense that hurts Aparacio here. One of the reasons is that for an excellent defender moving to an easier position, one of the reasons the position is easier is because there are fewer opportunities for meaningful plays. If you have a +10 defender at shortstop, they’re not going to suddenly become a +30 corner outfielder, because there just aren’t enough plausible plays for corner outfielders to be that far above average. On offense, it’s different — when moving a DH to third base, the DH doesn’t also have fewer offensive opportunities as a result of playing third. That’s one of the reasons the general approach is to try and play guys at the hardest defensive positions they can decently handle.
On a combined Frank Thomas/Luis Aparicio team, Aparicio is the clear choice at shortstop, second base, and center field. At third base, it’s a coin flip; Thomas projects as awful defensively at third base, but Aparicio’s career 83 wRC+ is pretty bleak there as well. Playing shortstop, second base, and center field proves to be the optimal alignment under this methodology, bumping the Frank Thomas 89-73 solo record and the Luis Aparicio 80-82 solo record to a 94-68 team. It’s also a more balanced team, and while this roster is no longer dominating the runs scored column, it is still at a level that typically leads the league. On the other side, a team that is merely 115 runs below average defensively (as projected here) is still bad, but it probably won’t get the GM fired by the start of June.